
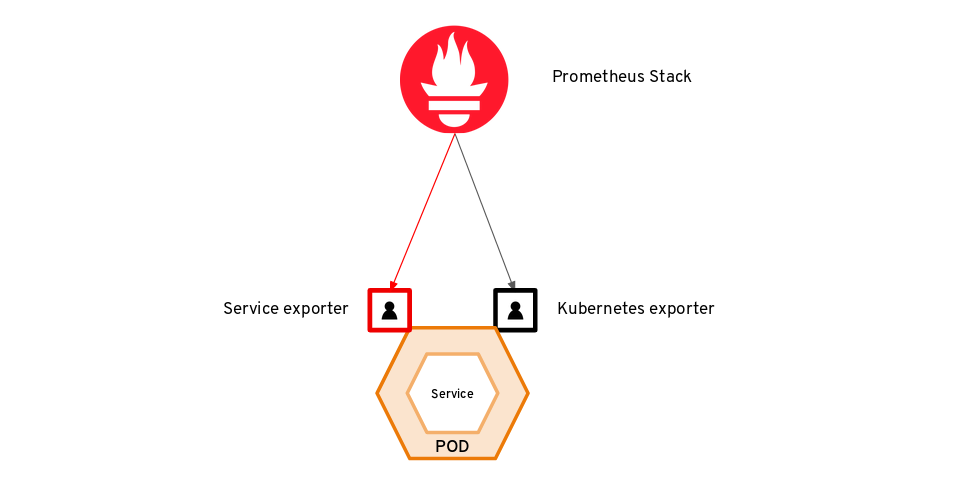
By default, if you are running OpenShift 4+, it comes with a nice Cluster Operator called “monitoring”. The Cluster Operator allows you to monitor the OpenShift nodes and Kubernetes API, it provides information regarding the cluster’s state, pods, and other cluster-wide diagnostics.
Cluster Operators are configured during the installation of the cluster and provide the core services for the OpenShift cluster.
[mkotelni@mkotelni ~]$ oc get clusteroperators
NAME                                       VERSION   AVAILABLE   PROGRESSING   DEGRADED   SINCE
...
monitoring                                 4.5.5     True        False         False      2d21h
...
An issue arose when developers and operators in different organizations realized that monitoring Kubernetes resources alone is not enough. Therefore, A new feature has been added to OpenShift’s monitoring stack — The ability for developers to monitor their own services and produce service-relevant metrics.
Demo — Monitoring a MariaDB database on OpenShift
In this demo I will go through the procedure of adding a service into the OpenShift Monitoring Stack, my service in this case will be MariaDB. The instructions in this demo might be specific for MariaDB, but they are relevant to any service which is able to expose metrics to Prometheus.
More information and examples can be found at the Official Documentation.
Prerequisites
- A running OpenShift 4.5 cluster.
- A running MariaDB server.
Configuration Walk-through
- Since monitoring your own services is not enabled in the monitoring stack by default, we will need to enable it by creating a new config map in the openshift-monitoring namespace.
[mkotelni@mkotelni ~]$ cat >> cluster-monitoring-config.yaml << EOF
apiVersion: v1
kind: ConfigMap
metadata:
  name: cluster-monitoring-config
  namespace: openshift-monitoring
data:
  config.yaml: |
    techPreviewUserWorkload:
      enabled: true
EOF
- After creating the new file, apply the new config map to the cluster.
[mkotelni@mkotelni ~]$ oc create -f cluster-monitoring-config.yaml
- Note that a new namespace has been created in the OpenShift cluster. The Prometheus server in this namespace will be in charge of the custom services that users in the cluster will monitor.
[mkotelni@mkotelni ~]$ oc get pods -n openshift-user-workload-monitoring
NAME                                   READY   STATUS    RESTARTS   AGE
prometheus-operator-865d8f4476-7l2bp   2/2     Running   0          5m
prometheus-user-workload-0             5/5     Running   1          5m
prometheus-user-workload-1             5/5     Running   1          5m
thanos-ruler-user-workload-0           3/3     Running   0          5m
thanos-ruler-user-workload-1           3/3     Running   0          5m
- Validate the your MariaDB database is up and running.
[mkotelni@mkotelni ~]$ oc get pods -n mariadb
NAME               READY   STATUS      RESTARTS   AGE
mariadb-1-deploy   0/1     Completed   0          6m34s
mariadb-1-sqsv2    1/1     Running     0          6m26s
- Configure the MySQL exporter so that the Prometheus server will be able to scrape metrics and save them in it’s Time Series DataBase. The exporter will receive connection parameters to the DB as an argument, so it could access the data needed for metrics production.
Prometheus Exporters — Agents that expose the service’s metrics to a Prometheus server. The exporter accesses the service’s data, and exposes it in a unique format so Prometheus will be able to parse it and save it in it’s database.
[mkotelni@mkotelni ~]$ oc new-app docker.io/prom/mysqld-exporter -e DATA_SOURCE_NAME=":@(:3306)/"
Example:
[mkotelni@mkotelni ~]$ oc new-app docker.io/prom/mysqld-exporter -e DATA_SOURCE_NAME="root:Password@123@(mariadb.mariadb.svc.cluster.local:3306)/"
- A pod will be created for the exporter. Make sure that it is up and running.
[mkotelni@mkotelni ~]$ oc get pods
NAME                       READY   STATUS      RESTARTS   AGE
mariadb-1-7q9mt            1/1     Running     0          8m56s
mysqld-exporter-1-6z25l    1/1     Running     0          7m30s
- (Optional) To check whether the exporter is producing metrics, you could expose the service as a route, and try to access it.
[mkotelni@mkotelni ~]$ oc create route edge --service=mysqld-exporter
route.route.openshift.io/mysqld-exporter created
- (Optional) After the route has been created, try accessing the route and check out the metrics!
[mkotelni@mkotelni ~]$ oc get routes
NAME              HOST/PORT                              PATH   SERVICES          PORT       TERMINATION   WILDCARD
mysqld-exporter   mysqld-exporter-mariadb.apps.ocp.lab          mysqld-exporter   9104-tcp   edge          None

[mkotelni@mkotelni ~]$ curl https://mysqld-exporter-mariadb.apps.ocp.lab/metrics -k
...
mysqld_exporter_build_info{branch="HEAD",goversion="go1.12.7",revision="48667bf7c3b438b5e93b259f3d17b70a7c9aff96",version="0.12.1"} 1
# HELP process_cpu_seconds_total Total user and system CPU time spent in seconds.
# TYPE process_cpu_seconds_total counter
process_cpu_seconds_total 0.08
# HELP process_max_fds Maximum number of open file descriptors.
# TYPE process_max_fds gauge
process_max_fds 1.048576e+06
# HELP process_open_fds Number of open file descriptors.
# TYPE process_open_fds gauge
process_open_fds 7
# HELP process_resident_memory_bytes Resident memory size in bytes.
# TYPE process_resident_memory_bytes gauge
process_resident_memory_bytes 1.4393344e+07
# HELP process_start_time_seconds Start time of the process since unix epoch in seconds.
# TYPE process_start_time_seconds gauge
process_start_time_seconds 1.59946185494e+09
...
- Before continuing, validate the port name of the exporter’s service.
[mkotelni@mkotelni ~]$ oc describe service/mysqld-exporter
Name:              mysqld-exporter
Namespace:         mariadb
Labels:            app=mysqld-exporter
                   app.kubernetes.io/component=mysqld-exporter
                   app.kubernetes.io/instance=mysqld-exporter
Annotations:       openshift.io/generated-by: OpenShiftNewApp
Selector:          deploymentconfig=mysqld-exporter
Type:              ClusterIP
IP:                172.30.56.245
Port:              9104-tcp  9104/TCP
TargetPort:        9104/TCP
Endpoints:         10.131.0.8:9104
Session Affinity:  None
Events:
- After validating the exporter, create the ServiceMonitor CR to connect the newly created exporter to OpenShift’s monitoring stack.
[mkotelni@mkotelni ~]$ cat >> servicemonitor.yaml << EOF
apiVersion: monitoring.coreos.com/v1
kind: ServiceMonitor
metadata:
  labels:
    k8s-app: mysqld-exporter
  name: mysqld-exporter
  namespace:
spec:
  endpoints:
  - interval: 30s
    port:  (obtained in previous step)
    scheme: http
  selector:
    matchLabels:
      app: mysqld-exporter
EOF
- Create the ServiceMonitor CR.
[mkotelni@mkotelni ~]$ oc create -f servicemonitor.yaml
servicemonitor.monitoring.coreos.com/mysqld-exporter created
- Connect to the Administration Portal in the OpenShift console. Navigate to the Monitoring →Metrics tab.
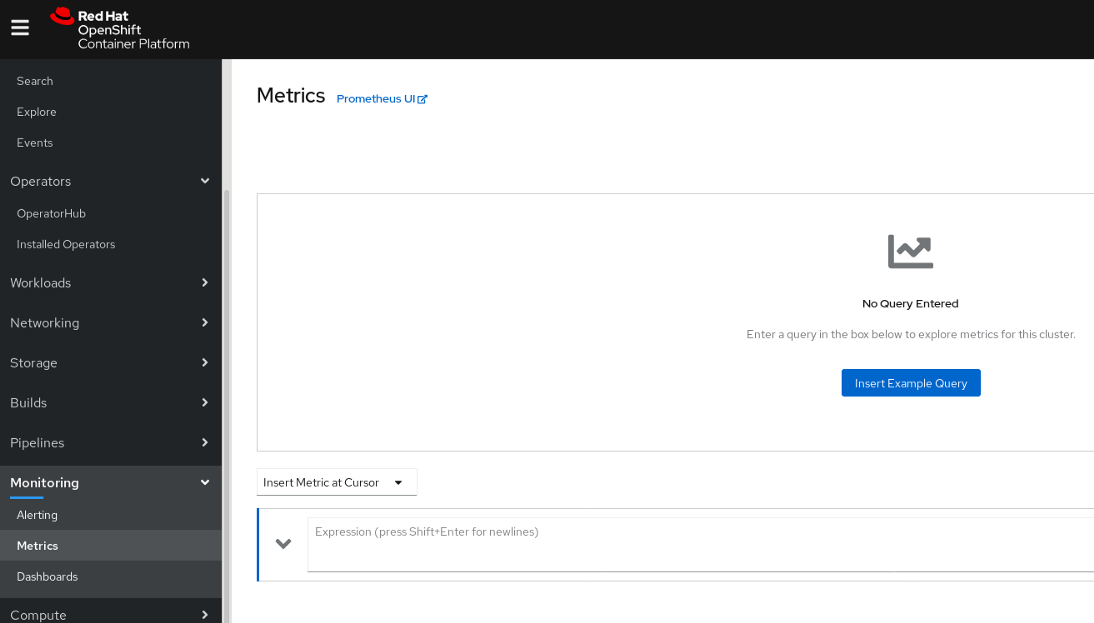
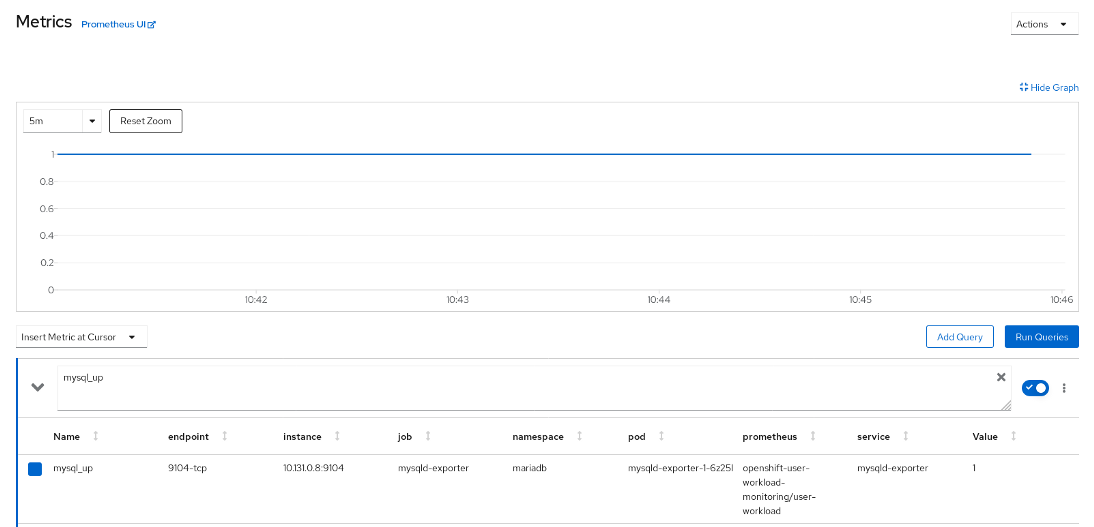
- You will be able to search MariaDB’s metrics in the ‘Metrics’ tab. Try looking for the ‘mysql_up’ metric. And press on ‘Run Queries’.
Configuration Alerts
Now that you are monitoring your custom services on top of OpenShift, you might need to get notifications if something is wrong with your services.
In this part, I will demonstrate the configuration of an alert that will trigger if the MariaDB service will go down for some reason.
- Create a file for a PrometheusRule CR. The PrometheusRule will contain a condition for which the alert will be triggered. In our case it is — `mysql_up{job=”mysqld-exporter”} != 1` Which will trigger the alert if the mysql_up metric will return values which are not 1 (1 represents that MariaDB is up).
[mkotelni@mkotelni ~]$ cat >> prometheusrule.yaml << EOF
apiVersion: monitoring.coreos.com/v1
kind: PrometheusRule
metadata:
  name: mariadb-status
  namespace:
spec:
  groups:
  - name: access_alert
    rules:
    - alert: MariaDBStatus
      expr: mysql_up{job="mysqld-exporter"} != 1
EOF
- Create the PrometheusRule CR.
[mkotelni@mkotelni ~]$ oc create -f prometheusrule.yaml
- To check the alert status, you will need to obtain the route of the Thanos Ruler (Thanos Ruler will manage and aggregate alerts created for custom services).
[mkotelni@mkotelni monitor-applications]$ oc get routes -n openshift-user-workload-monitoring
NAME           HOST/PORT                                                      PATH   SERVICES       PORT   TERMINATION          WILDCARD
thanos-ruler   thanos-ruler-openshift-user-workload-monitoring.apps.ocp.lab          thanos-ruler   web    reencrypt/Redirect   None
- Check out the alert using the web browser.
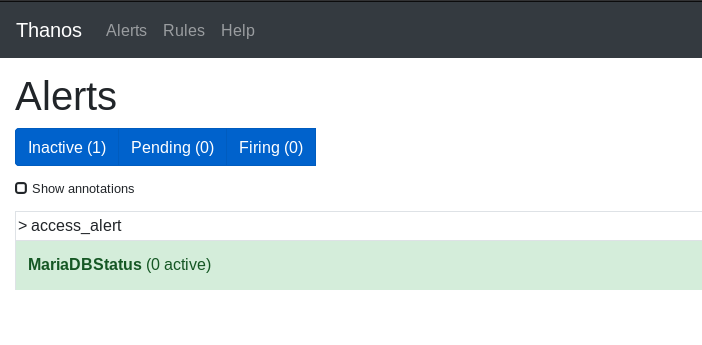
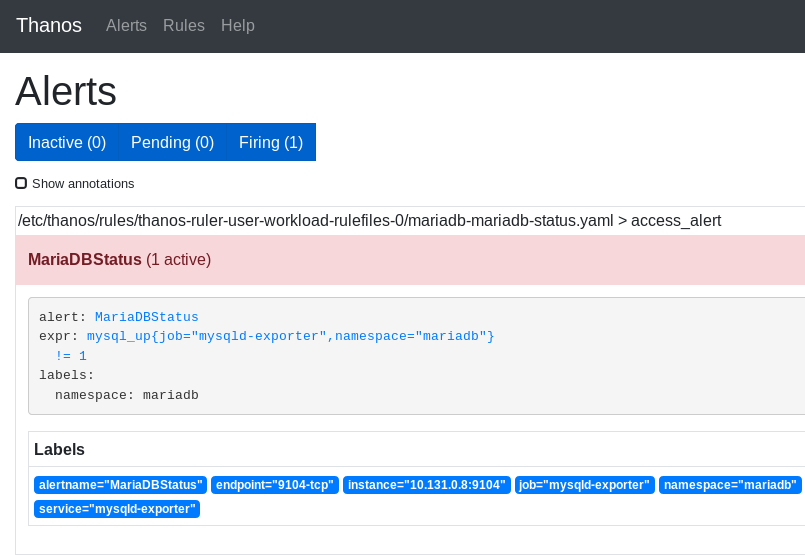
- Let’s trigger the alert by removing the MariaDB’s service, thereby, disconnecting the DB from the network (You could use a different method to trigger the alert).
[mkotelni@mkotelni monitor-applications]$ oc delete svc/mariadb
service "mariadb" deleted
- Note that the alert has been triggered.
Conclusion
Monitoring in OpenShift is awesome. You can monitor the infrastructure and the services in the same monitoring stack! It is simple, intuitive and there is no need for extra tools or contracts.
As I mentioned before, the best thing in Prometheus is the fact that every platform or tool can be integrated into it very easily. Make sure to find or create the correct exporter for your service and you are set! Make sure to check Prometheus’s Documentation to fully understand its functions and features.
There are many other plugins and extra configurations that can be integrated into OpenShift’s monitoring stack. Make sure to check the Official Documentation for further features and examples.
